


 32 / 52

CORPORATE HIGHLIGHTS
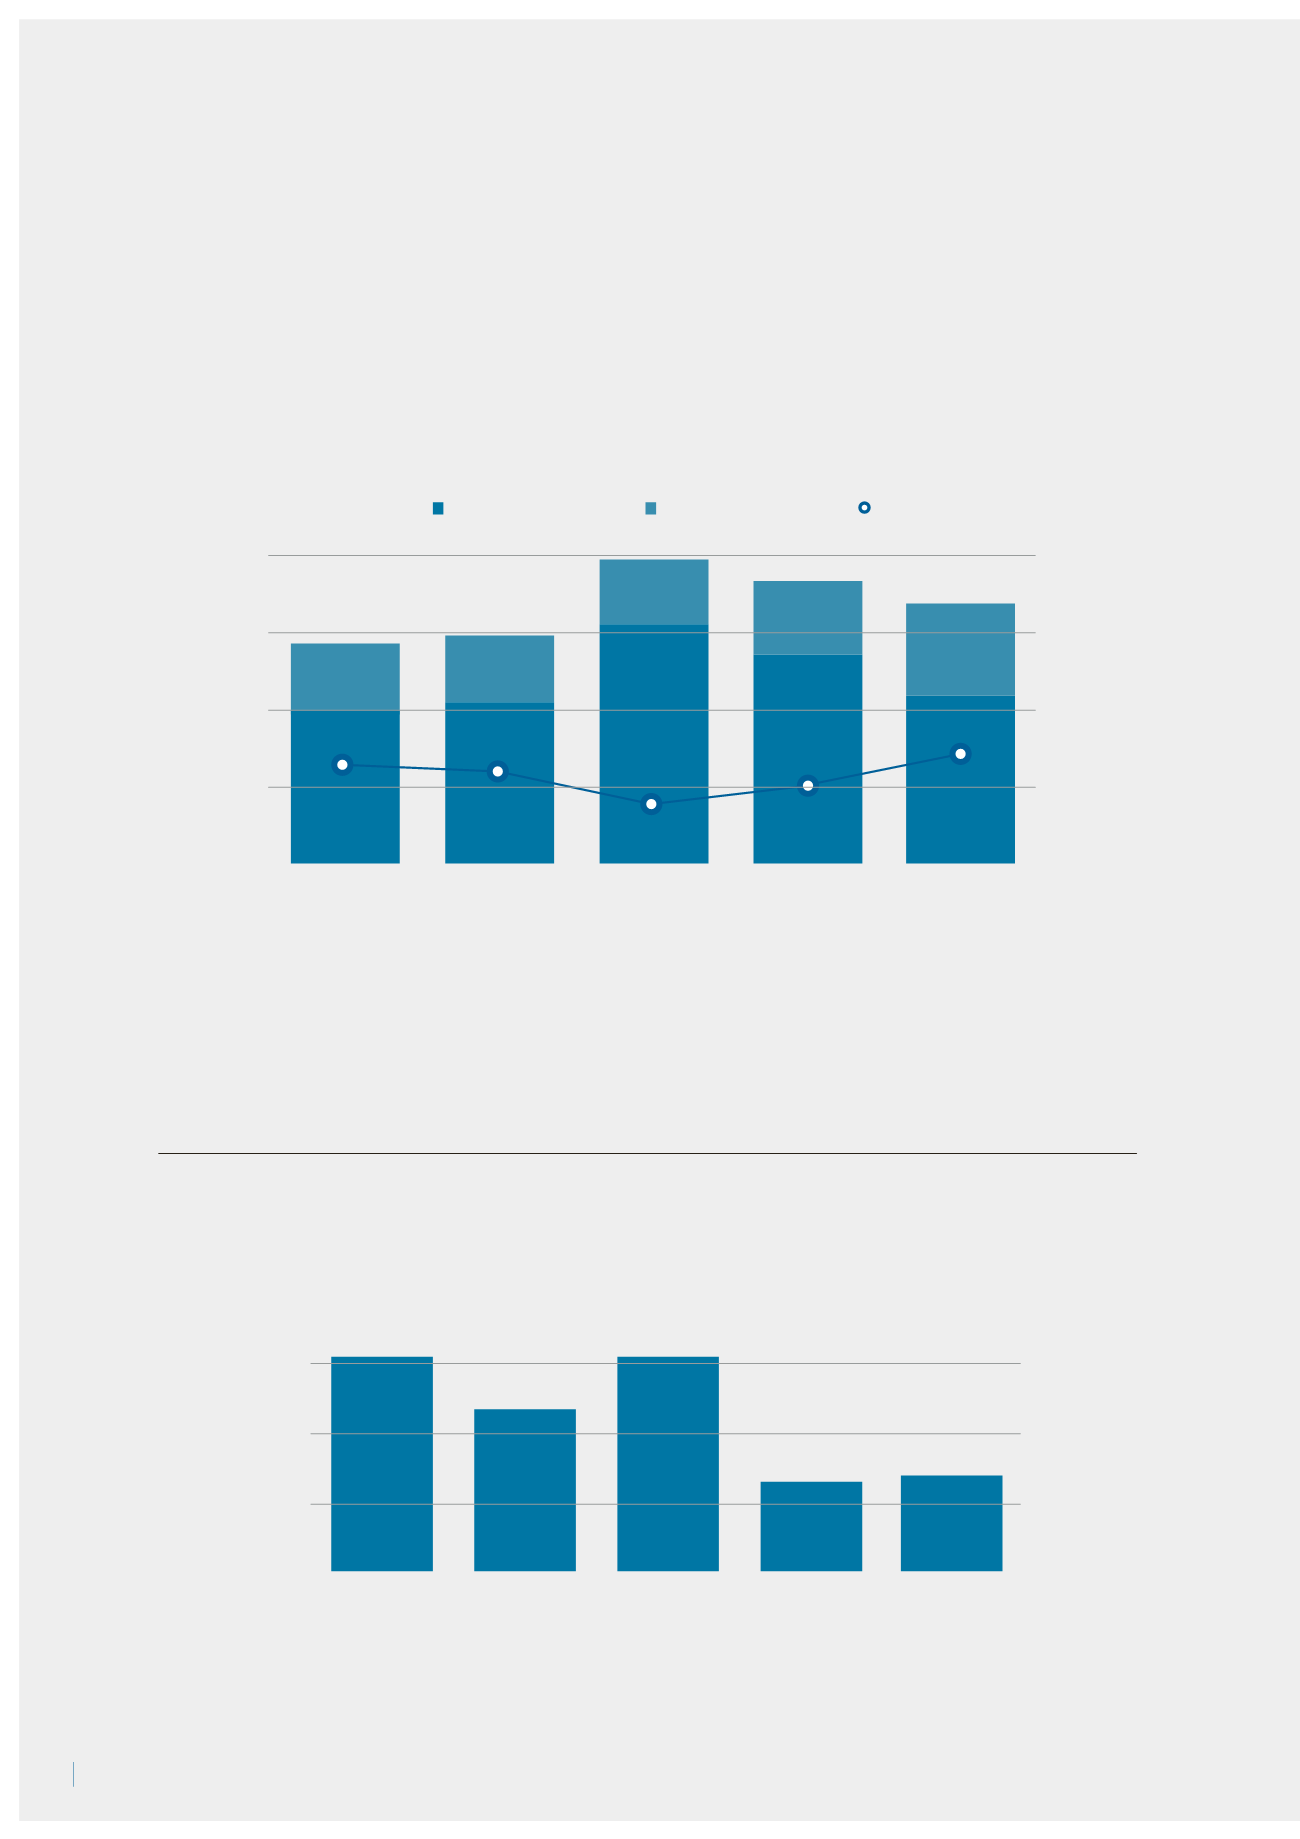
REVENUE
In NOK 1000
OPERATING PROFIT
Revenue
2010
2011
2012
2013
2014
New Sales
499 496
527 664
778 460
677 100
546 330
After-Sales service
215 663
217 182
207 786
238 902
281 141
Total revenue
715 159
744 846
986 246
916 002
827 471
30.2%
29.2%
21.1%
26.1%
34.0 %
2010
2011
2012
2013
2014
155 599
118 236
155 886
65 884
67 009
32
Annual Report 2014
1000
2010
2010
2011
2012
2013
2014
New Sales
After-Sales service
2011
2012
2013
2014
750
500
250
0
50
25
0
0
50
100
150
%