


 33 / 52

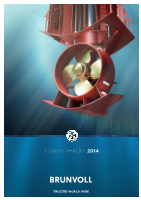
CASH FLOW FROM OPERATIONS
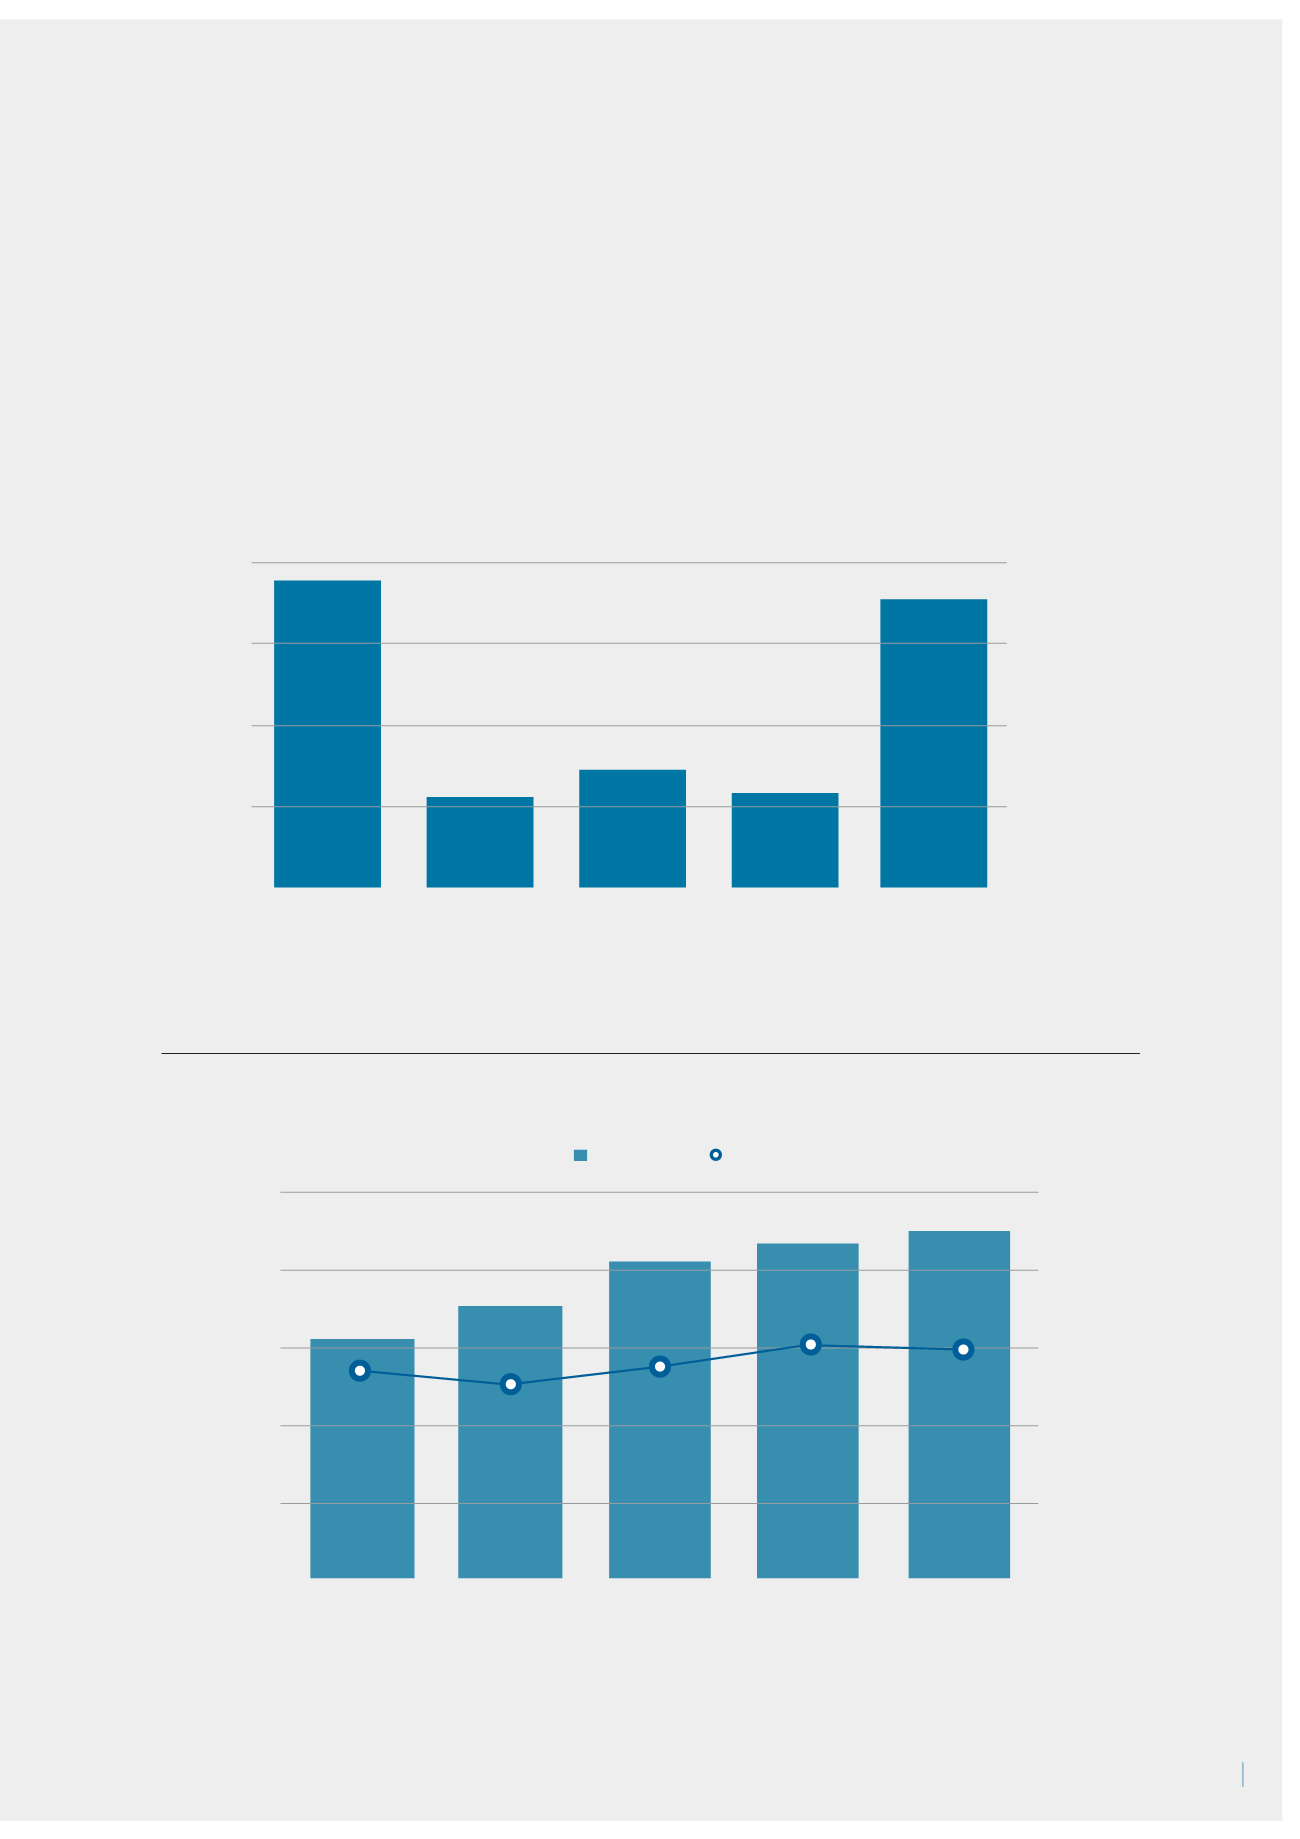
EQUITY
2010
2011
2012
2013
2014
372 754
425 228
493 099
521 917
546 162
54.2%
50.6%
55.0%
60.7%
59.6%
2010
2011
2012
2013
2014
168 896
50 813
65 755
53 352
151 880
33
180
%
NOK
600
450
300
150
0
100
80
60
40
20
2010
2011
2012
2013
2014
2010
2011
2012
2013
2014
135
90
45
0