


 31 / 52

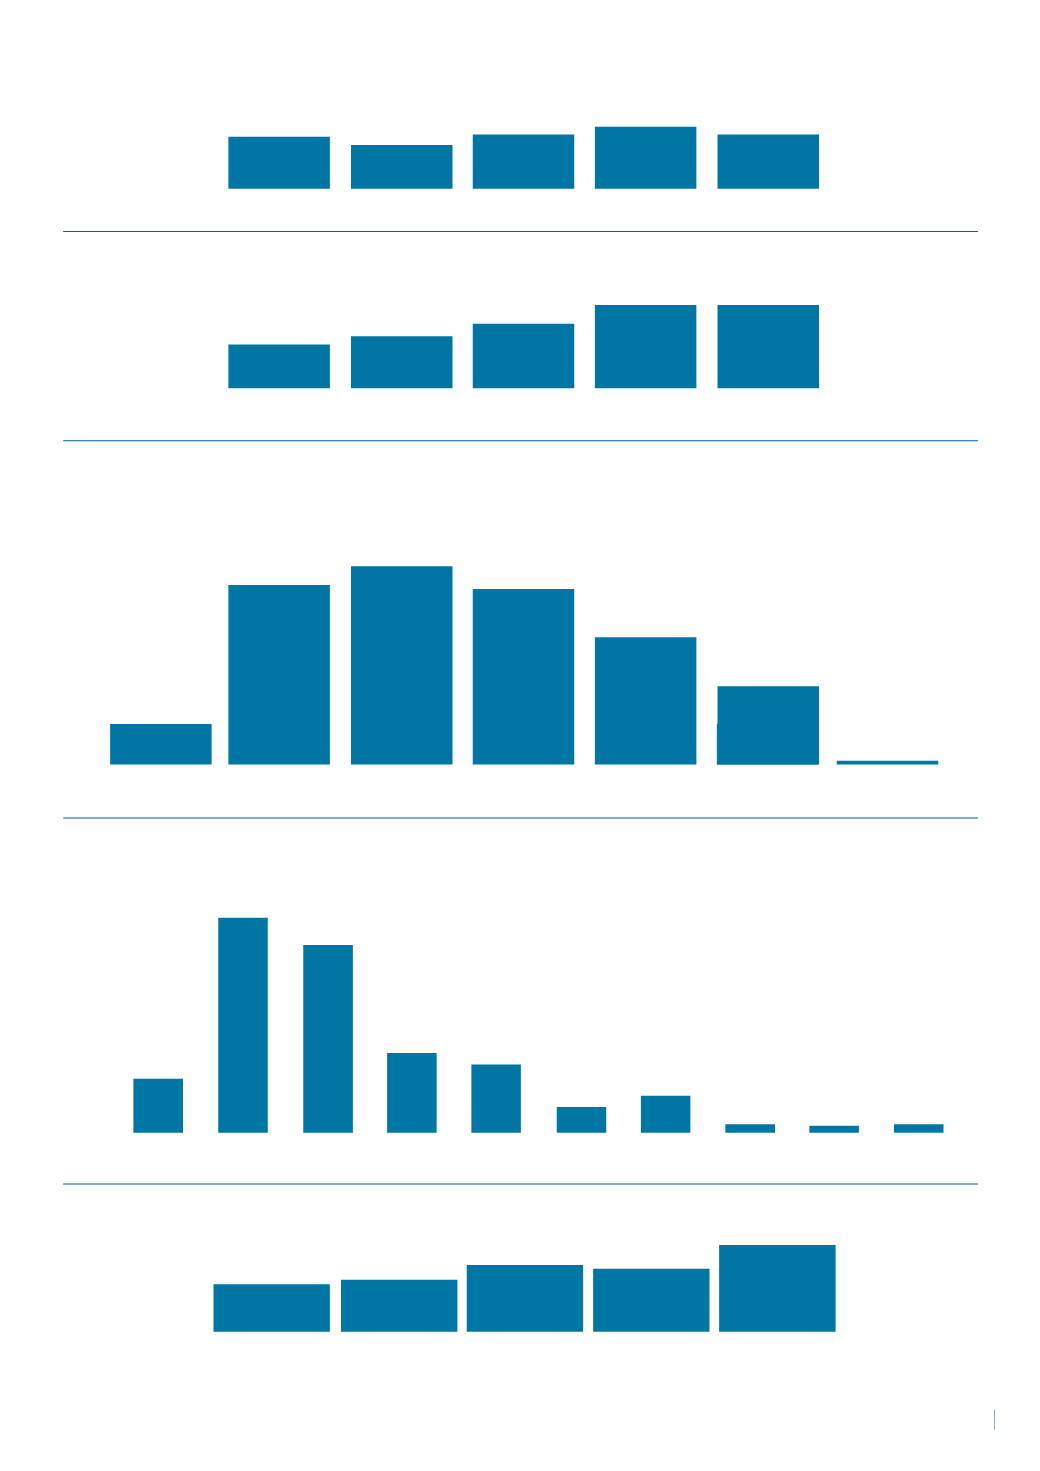
SICK LEAVE
EMPLOYEES
AGE STRUCTURE
(NUMBER OF EMPLOYEES)
LENGTH OF EMPLOYMENT
(YEARS)
GENDER DISTRIBUTION – FEMALE %
3.4%
249
77
95
15
28
10.4%
3.2%
264
82
89
10.9%
3.5%
296
76
41
12.2%
3.6%
332
58
35
11.9%
3.5%
332
23
13
5
1
17
4 5
13.4%
2010
2010
20-29
1-5
<20
<1
2010
2011
2011
30-39
5-10
2011
2012
2012
40-49
10-15
2012
2013
2013
50-59
15-20
2013
2014
2014
60-69
20-25
30-35
70-79
25-30
35-40 40 >
2014
31